

The commemoration of 9/11 and pullout of U.S. troops from Afghanistan marked the passing of 20 difficult years. Historians will debate the lessons to be drawn from this tumultuous time for decades to come. For investors, however, a crucial investment lesson to be drawn is clear: In the past 20 years, amid the tumult and difficulties, broadly diversifying paid off, and quite convincingly at that!
These are the chief findings of a study of the 12 asset classes for which risk and return data are available for at least 20 years. The author of the study, Craig Israelsen, Ph.D., is a professor of finance for over three decades and an expert on portfolio design.
According to Dr. Israelsen, the Standard & Poor’s 500 stock index averaged a 7.5% return annually for the 20 year period ended December 31, 2020 and had a standard deviation – a measure of its risk -- of 17.8%. In contrast, a broadly diversified portfolio comprised of 12 assets equally weighted delivered 91% of the return of stocks but with only 69% of the risk.
A portfolio with 12 equal weightings of different investments had a standard deviation of 12.3 and a return of 6.8%. That’s a good tradeoff for investors: accepting about 10% less return with a 30% reduction in volatility.
It’s clear evidence that, even over a 20-year period of world-shaking events, a strategic approach of broad diversification worked.
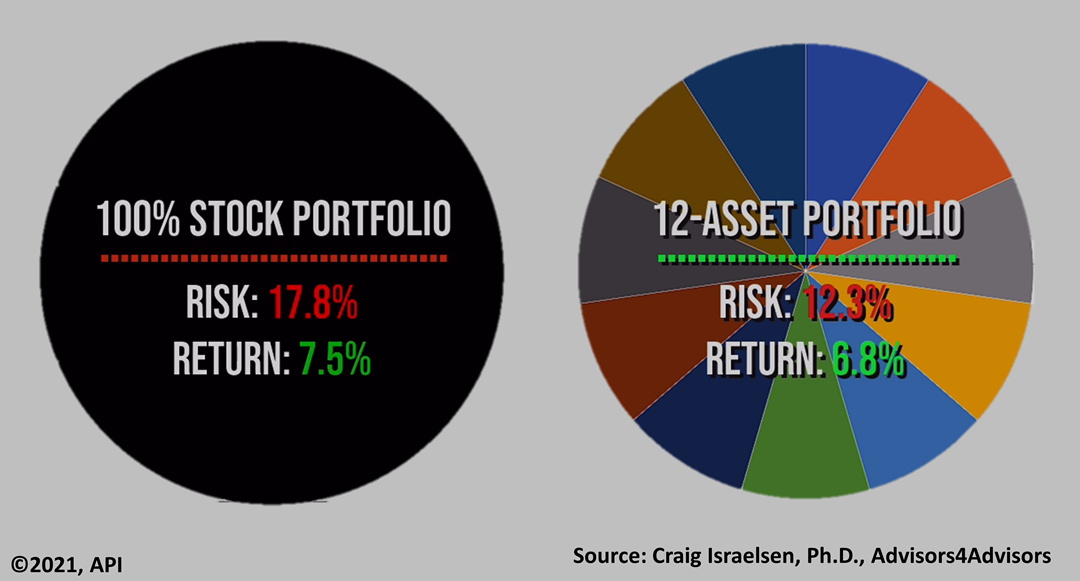
A one- asset portfolio having 100% in a high-risk, high-reward investment, like stocks, averaged a strong 7.5% annualized return, but you would have had to endure wild swings in the value of your portfolio that annually averaged 17.8%. For example, in the five-week Covid bear market of February-March 2020, instead of suffering the 33.9% drop in value on the all-stock portfolio, the 12-asset portfolio suffered a much more tolerable 21% loss. Wild ups and downs make investors more prone to selling at market bottoms.
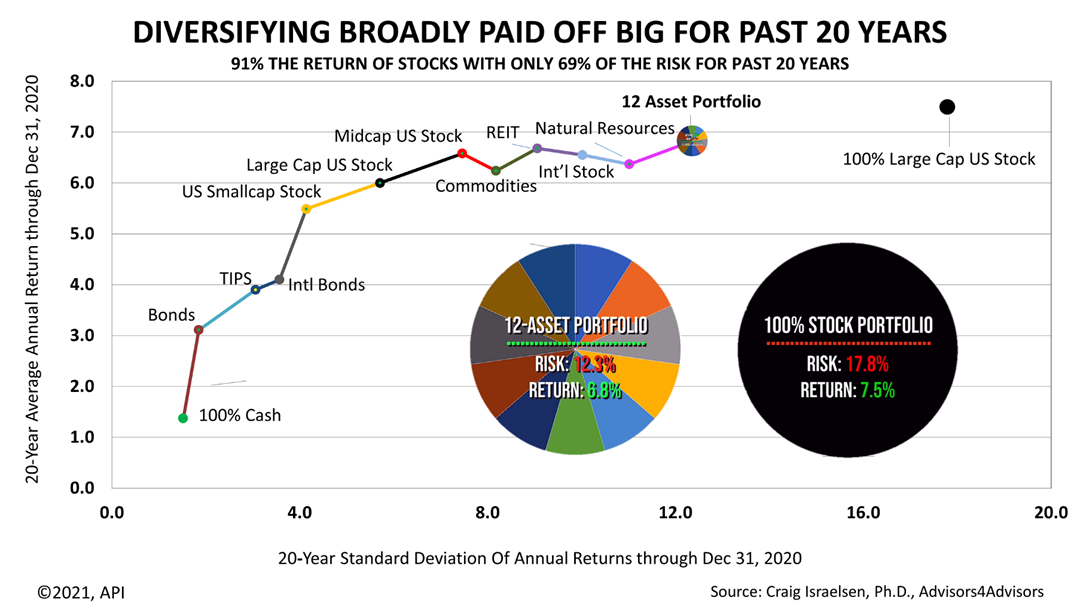
To better understand this concept so crucial to investor success, the multicolored line charts the standard deviation and return of each of the 12 asset classes for the 20 years ended December 31, 2020. Each dot plots the risk and return annually averaged for an asset class.
The risk and return statistics all are based on indexes that track the 12 assets. The 12 assets are tracked by Dr. Israelsen because they form a broadly diversified portfolio, meaning they have different characteristics that can be measured statistically. In addition, they are indexed and, thus, enable a low-expense investment management approach.
Starting with the least volatile of the 12 assets, the multicolored line shows what each of the 12 assets added to the portfolio. Adding each of the 12 assets in equal amounts for the 20-year period created the very favorable risk/return curve in this chart. The combination of all 12 asset classes yielded the most efficient portfolio, compared to any combination of one or more assets.
Strategically investing in a broad set of assets worked even during one of the most difficult 20 years of the modern era.
Total return and standard deviations for the 12 asset classes were represented by the following indexes.
|
12 Asset Classes |
Indexes |
|
Cash |
USTREAS Stat US T-Bill 90 Day |
|
US Bonds |
Barclays US Aggregate Bond Index |
|
TIPS |
Barclays U.S. Treasury US TIPS Index |
|
Non-US Bonds |
Barclays Global Treasury Index |
|
Small US Stock |
S&P Small Cap 600 Index |
|
Large US stock |
S&P 500 Index |
|
Mid US stock |
S&P Midcap 400 Index |
|
Commodities |
Deutsche Bank Liquid Commodity Optimum Yield |
|
Real Estate (Commercial) |
S&P Global REIT Index |
|
Developed Non-US stock |
MSCI EAFE Index NR |
|
Natural Resources |
S&P North American Natural Resources Index |
|
Emerging Markets stock |
MSCI EM Index GR |
This website uses cookies for navigation, content delivery and other functions. By using our website you agree that we can place cookies on your device. I understand
