Key forwarding-looking data are very strong, indicating the market-up could go on.
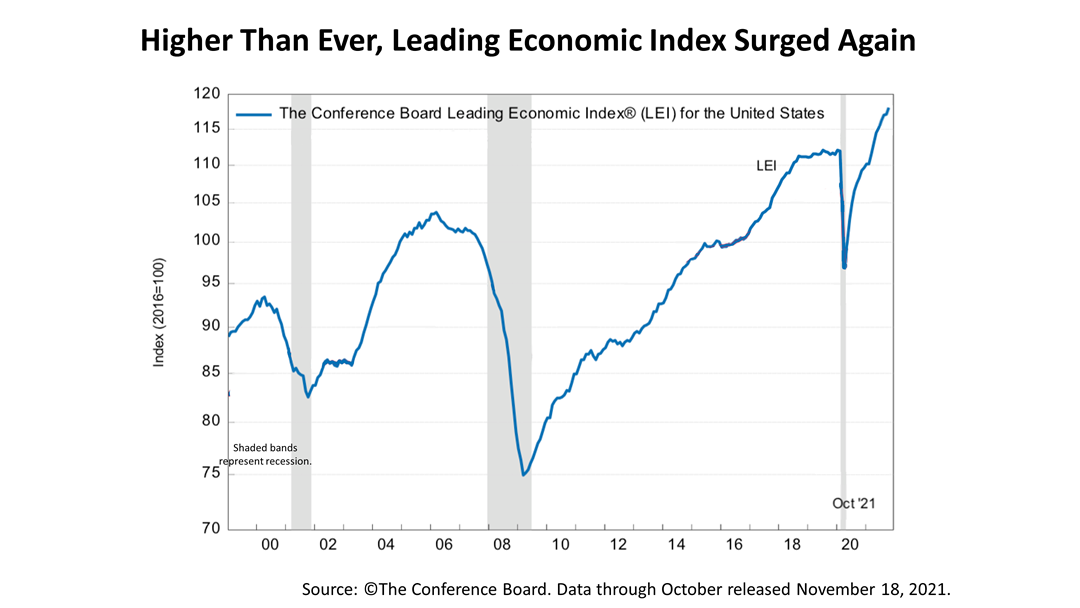
The U.S. Leading Economic Index (LEI), has soared well beyond heights previously reached in modern history in recent months, and it surged again last month. The LEI rose nine-tenths of 1% in October, following an increase of one-tenth of 1% in September and seven-tenths of 1% in August.
The economics team at The Conference Board, a big-business group that calculates the LEI, says October’s surge suggests the current economic expansion will continue into 2022 and may even gain momentum in the final months of 2021. The Conference Board forecasts growth will stay strong in the fourth quarter, at about a 5% annualized rate, before moderating to 2.6% in the first quarter of 2022, which is a robust rate of growth compared to historical norm for the U.S.
Why should you care? Because you really want key economic drivers of investment markets to guide your portfolio in planning for retirement or building wealth for your family, friends, and charitable causes.
The LEI has a history as a reliable financial economic indicator of the future for two reasons:
- The LEI plunged before every recession in modern history -- except for the Covid downturn -- making it a strong indicator of future economic growth.
- A bear market in stocks was triggered by every recession in modern history, except for the bear market that began with the stock market crash of October 19, 1987, making the LEI a strong stock market indicator.
The LEI is a broad measure of what’s just ahead, because its 10 components reflect key forward looking drivers of financial economic growth
- Average weekly hours worked in manufacturing
- Average weekly initial unemployment claims
- Manufacturers’ new orders – consumer goods and materials
- Institute of Supply Management index of new orders index
- Manufacturing sector new orders, nondefense capital goods
- Building permits – new private housing units
- Stock prices, as measured by the S&P 500
- Leading Credit Index™
- Interest rate spread of the 10-year Treasury Bond minus the Fed Funds Rate
- Index of consumer expectations.
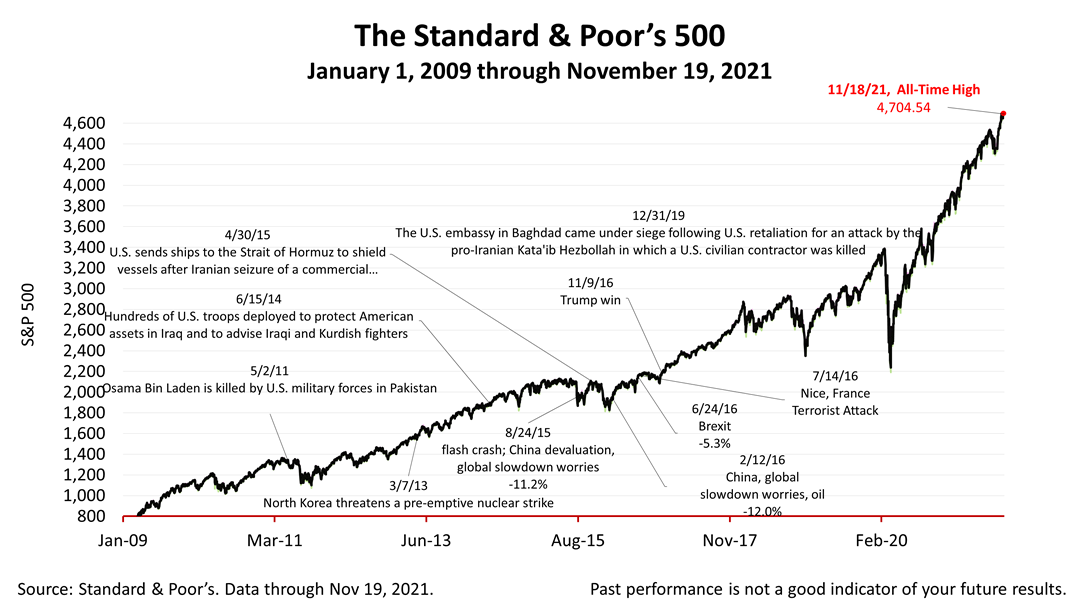
The Standard & Poor’s 500 stock index closed this Friday at 4,697.96, one-tenth of 1% from its all-time high closing price on Thursday. The stock index closed about three-tenths of 1% lower from last Friday.
A barometer of the strength of the United States, the value of the S&P 500 index, including reinvestment of dividends, since the March 23, 2020, covid bear-market low has grown by +70.95%. It’s astonishing!
Please contact us if you would like a free report about investment planning amid a stock market melt-up and the “bubbliness” of the stock market.