
State of the Markets
The combination of multiple stimulus packages, millions of people getting vaccinated, and a robust economic forecast have resulted in a sharp increase in interest rates over the first quarter of 2021. Short-term rates barely changed since our last update, although the 5-year Treasury note yield increased 56 basis points, the 10-year Treasury-note yield increased 81 basis points, and the yield on long 30-year bonds increased 75 basis points. The bond market is clearly concerned that inflation is going to rise, as we warned about over previous quarters.
The S&P 500 advanced 6% in the 1st quarter, the NASDAQ advanced 3%, and the small cap index increased 18%. The brighter outlook for the economy, due to the vaccine rollout combined with yet another potential stimulus package, put a little fear into the bond market and boosted the outlook for corporate profits which has extended last year’s performance in the equity markets.
Pension Plan Index Update
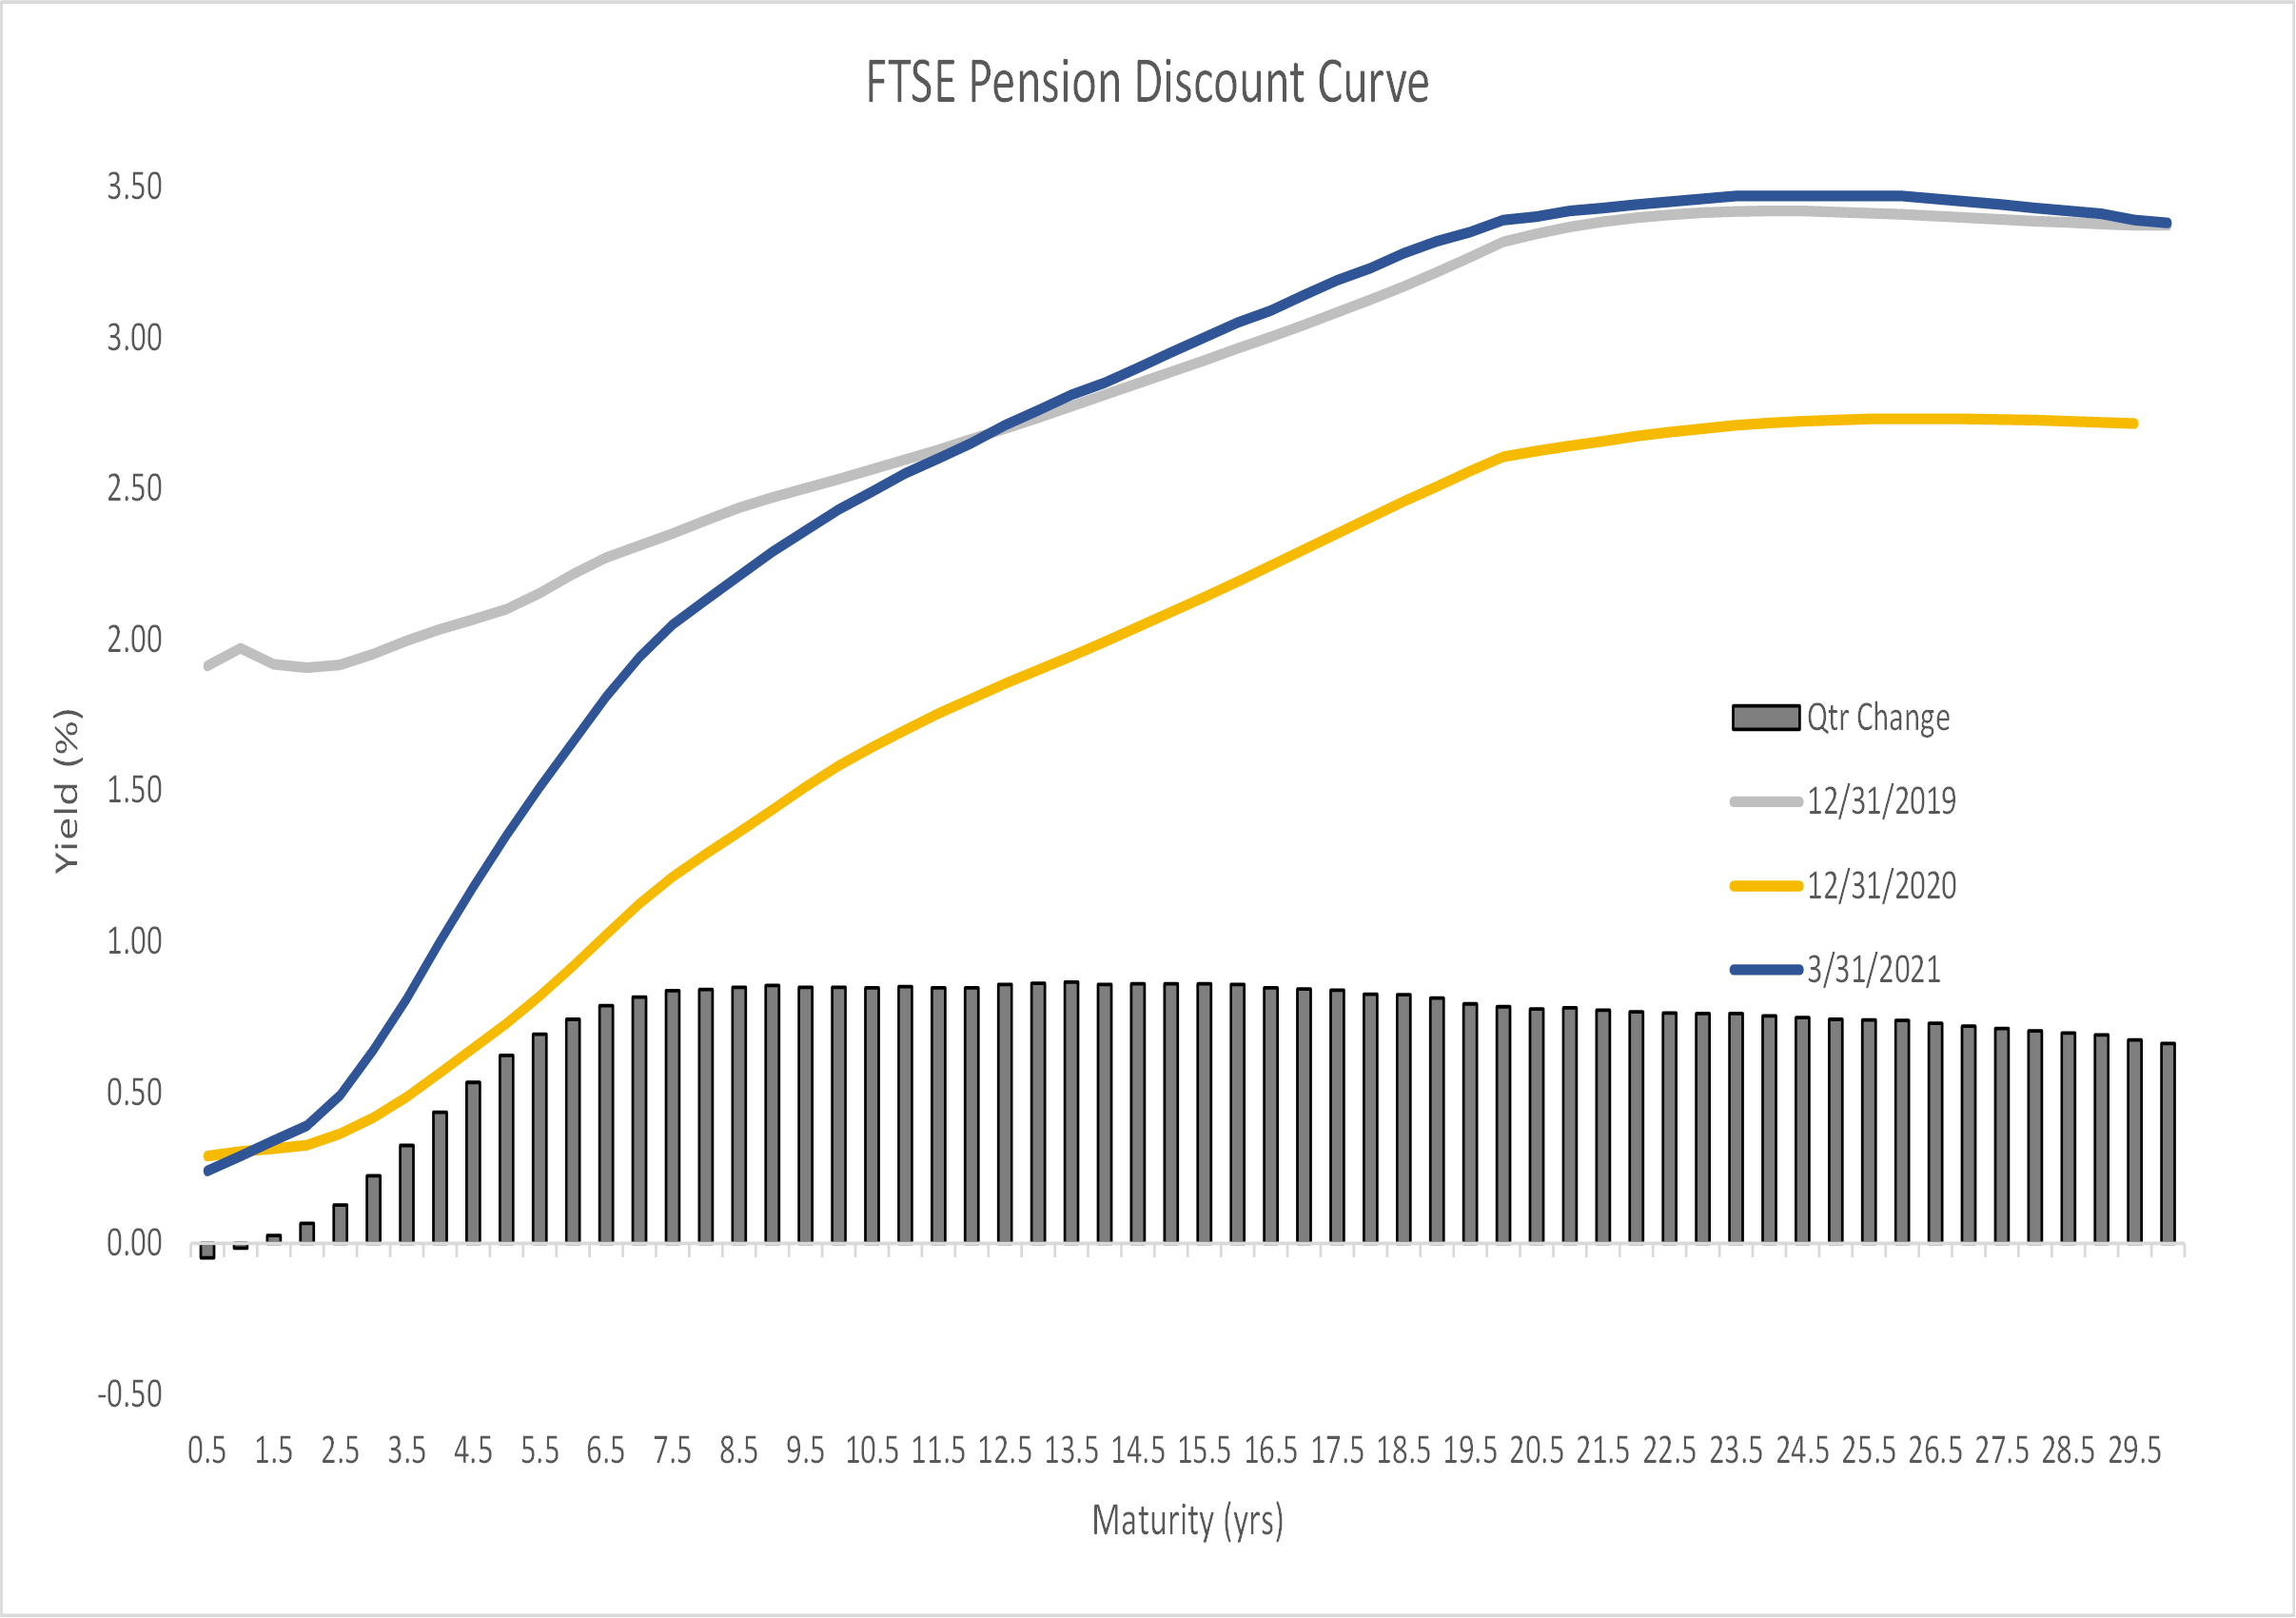
Pension discount rate movements mimicked that of the greater fixed-income markets over the quarter with shorter maturities exhibiting little change while the belly and long-end of the curve resulted in significant upward changes. As of December 2020, the single discount rate measured 2.46% while it now measures 3.12%, marking the first time in the past twelve months where the rate registered above 3%. For a majority of 2020, the rate had been declining with only recent activity exhibiting the reverse. The impact of this 0.66% increase in the rate over the 1st quarter was a drop in liability values by an average of 8% as measured by the Milliman 100 Monthly Pension Funding Index. Asset returns, as measured by the index, showed a modest 0.09% increase and so improvement in the funded status of the index universe were more significantly affected by the decrease in liability values than from a slight increase in asset values. For the quarter, the average index plan’s funded ratio improved from 90.3% to 98.3%. This sort of improvement seems to perfectly exhibit why implementing a dynamic glide-path in combination with a liability matching investment strategy is a valuable effort.
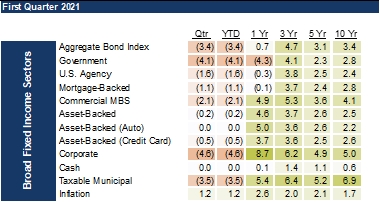 Absolute fixed-income returns across many of the bond sectors resulted in negative returns over the quarter with both higher quality and longer duration securities underperforming that of lower quality and shorter duration securities. Long-term return trends remained positive, favoring lower quality and longer maturities. Credit spreads in investment grade credits demonstrated modest tightening of 0.04% while high yield credit spreads tightened by 0.42%. Credit spreads can be thought of as compensation for an investor accepting the potential of a default. Tightening of spreads translates into a willingness, by market participants, to accept less yield for that risk and is coherent with an improving economic outlook.
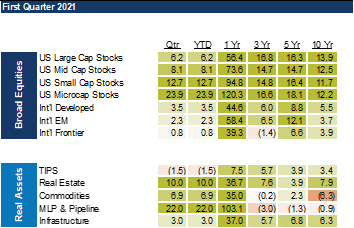 Consistent with that conclusion are the performance results of risk assets over the period. US Large Cap stocks improved over 6%, reaching nearly a 60% return during the prior twelve months. As is common in bull markets, investors in higher risk assets are compensated to greater extent. This is best seen in the difference between large and small capitalized stocks over the recent past.
Economic Outlook
Many people and institutions are realizing the effects of recent federal stimulus bills. It would be reasonable to think this could be the spark that gets the economy moving. Putting money in the hands of consumers may be a smart political move, but it also may be an attempt at learning a lesson from past economic history.
At the end of 1989, Japan’s Nikkei stock market index hit 38,916. Japan moved in and out of recessions throughout the 1990’s and the low point for the Nikkei was in late 2002 when the index bottomed out at 8,303. The episode is often referred to as “The Lost Decade.” In overly simplified terms, the main causes were a central bank that reduced the money supply (in response to signs of inflation) which precipitated the stock market crash, along with a real estate market sell-off, translating into a credit crunch as banks became overly conservative (since real estate collateral was rapidly falling in value), followed by a “liquidity trap” where households increased savings and were slow to spend. One could argue that the U.S. feels like it is in a liquidity trap now that savings rates have increased and since the Great Recession, the Fed’s ability to get people to spend (stimulate demand) has generally been unsuccessful. The Bank of Japan held their discount rate low for much of the 1990’s at 0.50% but deflation persisted. One could draw similar parallels with current US Fed policy. For example, the Fed Funds rate is targeted at a range of 0% to 0.25%. Where the current U.S. policy partially differs is that Japan spent its fiscal stimulus dollars on inefficient public works projects and failing businesses, while the U.S. appears to be letting the market (consumers) decide where the stimulus is best spent. Some recipients are buying expensive shoes and handbags, while others are paying down debt and trying their luck by investing in the financial markets. Another material deviation is that the U.S. has been expanding the supply of money causing savings rates to fall and further enabling domestic banks to lend thereby avoiding a liquidity trap for consumers, at least for the moment.
A possible “dark cloud” on the horizon for real estate and banks in the U.S. could be commercial/retail property in high-tax and high-rent urban areas. As mentioned last quarter, Americans are moving to more affordable locations. Since the start of the pandemic, commercial rents in San Francisco and New York City have fallen 22% and 16%, respectively (accounting for concessions). Regulatorily-imposed, non-economic dispensation of bank loan access could be an example of an unforeseen cause of a credit crunch in the U.S. It could put banks in some areas of the country in the position to strategically shrink, or if creditworthy borrowers had to increasingly subsidize other borrowers, the appeal of borrowing may decrease, and they may choose to fund large purchases from increased savings. The point is that although the U.S. is not Japan of the 1990’s, we appear to be following the lesson of giving money straight to consumers, but we are only a policy misstep away from facing a similar scenario.
Away from the “Lost Decade” scenario, we see the most probable outcome of the current landscape as involving a dutifully stimulative Fed, a fiscal environment with a lot more spending to come, and some short-term signs of convincing growth. That sounds enjoyable. Unfortunately, at a point in every great adventure is a bill of some kind which must be paid. In relation to this scenario, taxes will need to be paid and in simple terms, money will have to flow from the hands of above-average producers, laborers, and savers to subsidize those who generate below average economic activity. A transfer of this type very likely results in diminished future economic growth at the aggregate level. The recently released Penn Wharton Budget Model surmises that the $2.5 trillion American Jobs Plan (the Biden administration’s first infrastructure plan) would result in GDP falling 0.9%, capital stock (stock values) would drop by 3%, hourly wages would decline by 0.7%, and government debt would increase by 1.7% over the next decade. The “positives” that model can’t quantify include the effect of carbon reduction, the value in helping the elderly, and the “X-factor” from government R&D (related to the plan’s $590 billion allocation to jobs training and R&D). The inevitable part where the economy experiences diminished future growth and constituents pay higher taxes will probably become a part of the market’s lowered expectations as the tax conversation becomes more real.
Tax rates, regulatory pressures, an uncertain business/investment environment, legislative changes, and compassionate incentives that contort labor markets may serve to hurt those for whom much of the extraordinary stimulus plans were designed to help. In an uncertain environment, business is more likely to invest in systems and automation, rather than human resources. Even if businesses want to hire, there are still many people who make more not working due to unemployment enhancements. We run the legitimate risk of having a soft employment environment on both the supply and demand side of the equation. Employers will be cautious to hire, and workers may make more on unemployment, or the jobs that are out there do not equate to full employment. Work ethic may soften, and skill sets may become stale, causing longer-term economic difficulties for some workers. Stimulus dollars are pushing up prices for some goods and services, so those who are left behind in the labor market could lose even more purchasing power and quality of life.
An extreme outlier of the current effort to reward work over wealth would be a scenario where we monetize debt to a level, and for unproductive purposes, that the value of the U.S. dollar and the economic engine that powers it becomes debased, effectively expunging debts. It could also serve to close the wealth gap as the dollar-based wealth of some people would become worth less on a global basis. Likely, some asset prices would inflate, especially income-producing assets, so the wealth equity goals sought by some would not be fully realized. Long before then, people will move into non-dollar stores of value as a necessary wealth risk reduction tool. Crypto-currency, non-fungible tokens (NFTs), art, numismatic coins, bullion, collectables, and just about any store of value will gain in value long before the U.S. dollar sees a significant slide in value. Perhaps the outlier scenario is not as far off as we might think.
The shock and awe of another spending plan on the order of $2 trillion to $3 trillion in the midst of GDP growth expectations exceeding 7%, could be what pushes the 10-year Treasury past the 2.0% level. We do not see a large risk that the high side of a spike in yields would go as high as 2.50%. Our basis is that the Fed’s dot plot shows that the neutral rate (the point where policy is neither accommodative nor restrictive) is 2.5% on a long-term basis. Since the dot plot was first released in 2012, it has been rare that longer-term bonds have exceeded that guidance. In the second half of the year, we expect that tax realities, workforce quality issues, safety net programs that have extended past their useful lives, and a lot of spending for consumption rather than productive purposes will result in diminished future economic expectations, driving yields lower.
We are passionate about fostering creative ideas and exploring new opportunities for the benefit of pension plan clients. Please contact our team at Advanced Capital Group to learn more on how we can assist with your defined benefit investment management needs.