
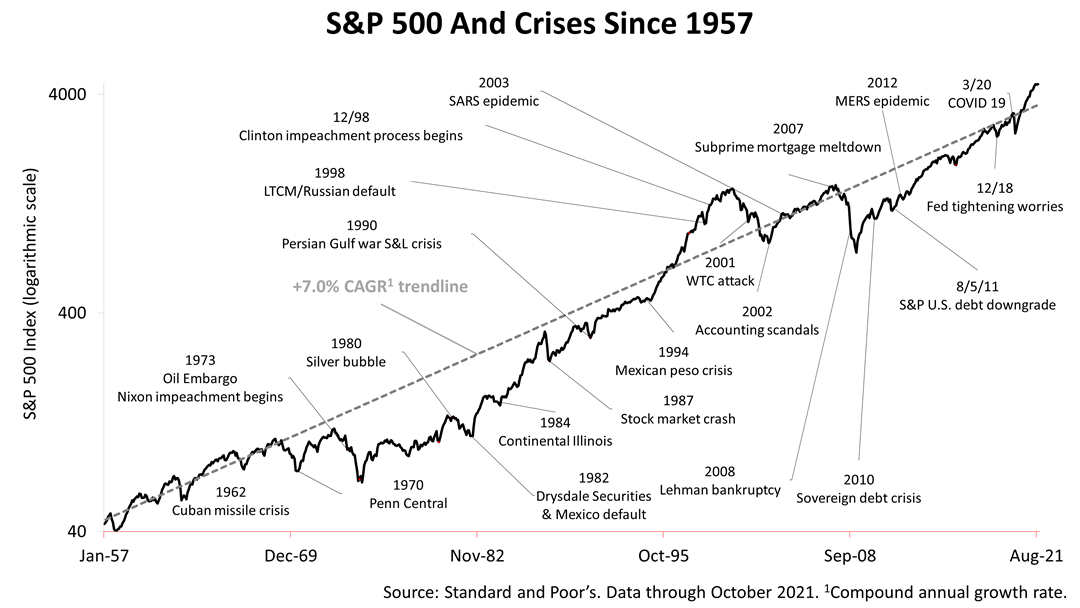
Here are 21 crises that occurred since 1957 charted against the performance of the Standard & Poor’s 500 index, a benchmark of the stock market and proxy for measuring the progress and strength of the United States.
Looking back on 64 years of modern American history, here are five observations to help investors plan for the decades ahead:
- From the late 1960s through 1995, stocks annually averaged less than the 7% rate averaged over the past 64 years.
- In 1997, the tech bubble began to form, and stocks soared for three years, through June 2000. It was the tech-stock bubble. It burst in mid-2000, and stocks plunged for nearly three years, through March 2003.
- Stocks have soared since the March 2020 Covid bear market low but are not even close to veering off the 7% trendline like they did in the tech-stock bubble of 2000.
- The Cold War with the Soviet Union does not figure prominently. A new cold war with China may also not be that important to American prosperity.
- Not reflected in this chart is that yields on bonds are lower than ever in U.S. history, which makes stocks more valuable relative to bonds than in the past. Stocks and bonds are the world’s two dominant investment asset classes. Stocks could veer further upward from the 7% trendline because of the new valuation paradigm of stocks versus bonds.
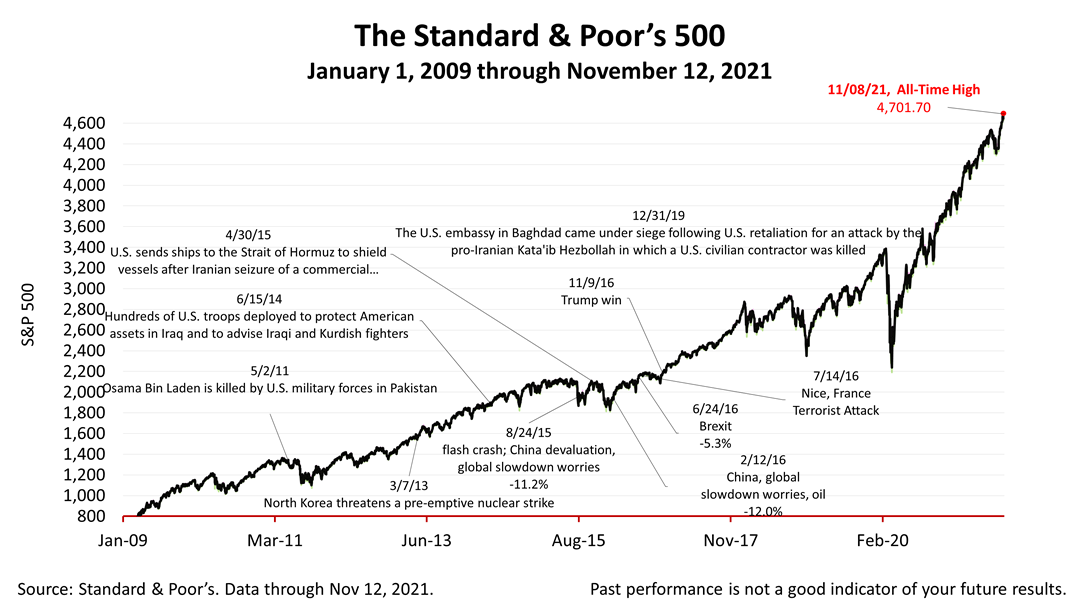
The Standard & Poor’s 500 stock index closed Friday at 4,682.85, fractionally off its all-time closing high reached earlier in the week. The index gained +0.72% from Thursday and is down -0.31% from last week. It is up +70.67% from the March 23, 2020, bear market low. For more information about the effect of the change in valuation of stocks versus bonds, please contact us.