
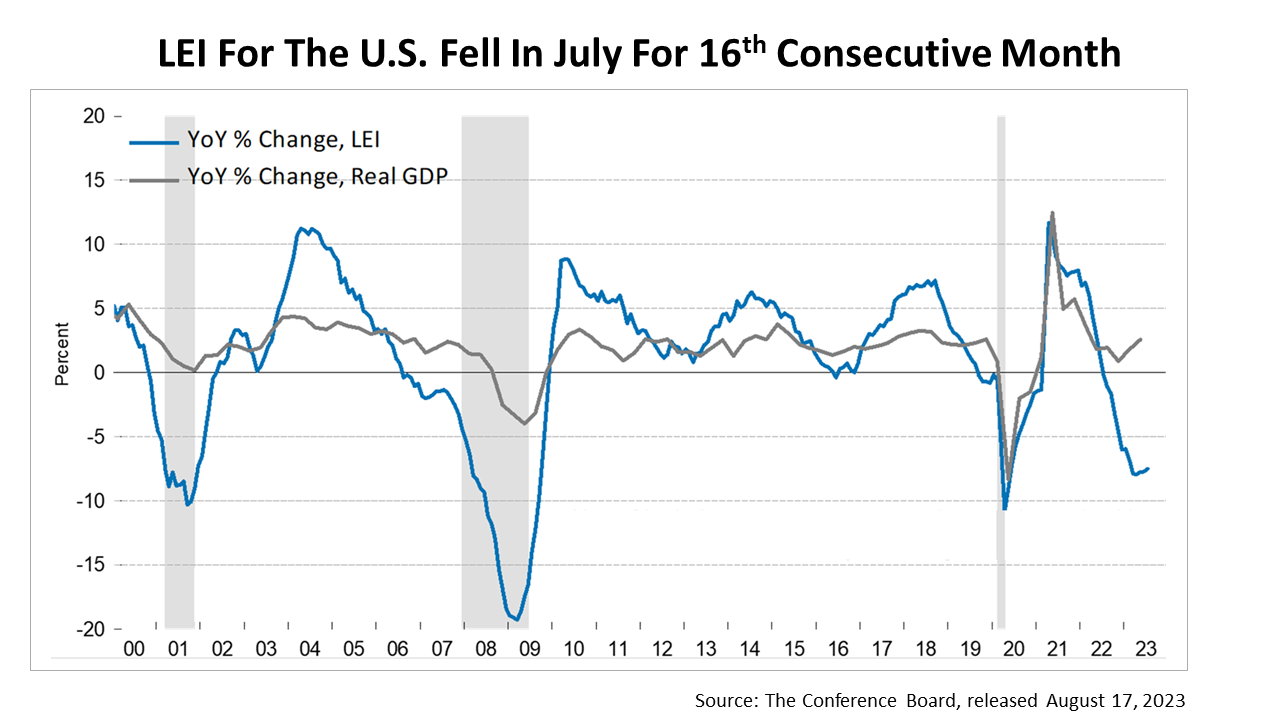
The Leading Economic Index (LEI) for the U.S. declined for the 16th consecutive month in July. “The leading index continues to suggest that economic activity is likely to decelerate and descend into mild contraction in the months ahead,” according to The Conference Board’s (TCB) data release on August 17. TCB is now forecasting “a short and shallow recession in the Q4 2023 to Q1 2024 timespan.”
TCB’s forecast for a recession in the near-future is a big story. TCB is a credible institution. TCB is an association for the world’s largest companies. It has collected, calculated, and published the LEI and its 10 subcomponent indexes for decades and employs a team of economists who have made the LEI a reliable predictor of every recession in modern U.S. history – except for the anomalistic Covid-19 recession. Thus, TCB’s forecast mistake is important to understand.
Things started to go wrong on July 21, 2022, when TCB for the first time in 14 years predicted a recession would begin at the end of 2022. It was a sudden about face. Just a month earlier, in June 2022, TCB had predicted a 2.3% U.S. growth rate for 2022. However, TCB suddenly reversed itself when its index of Leading Economic Indicators for the U.S. declined for the third month in a row. On July 21, 2022, TCB forecasted: “US recession around the end of this year and early next is now likely.”
A year later, with no recession in sight and robust growth widely expected for the rest of 2023, TCB has pushed back the recession start-date to the fourth quarter of 2023 or the first quarter of 2024.
Why has TCB’s forecast for a recession been wrong? Fritz Meyer, an independent economist, says the U.S. economy changed in recent decades but the LEI did not, and the manufacturing subcomponents are overweighted in the LEI index. The manufacturing sector of the economy accounts for only 10% of U.S. gross domestic product (GDP), while service-sector businesses account for 90% of GDP. The list of the 10 LEI subcomponents below highlights the influence of manufacturing in the LEI:
1) average weekly hours worked, manufacturing
2) average weekly initial unemployment claims
3) manufacturers’ new orders – consumer goods and materials
4) ISM index of new orders
5) manufacturers’ new orders, nondefense capital goods
6) building permits – new private housing units
7) stock prices, S&P 500
8) Leading Credit Index™
9) interest rate spread minus fed funds
10) index of consumer expectations.
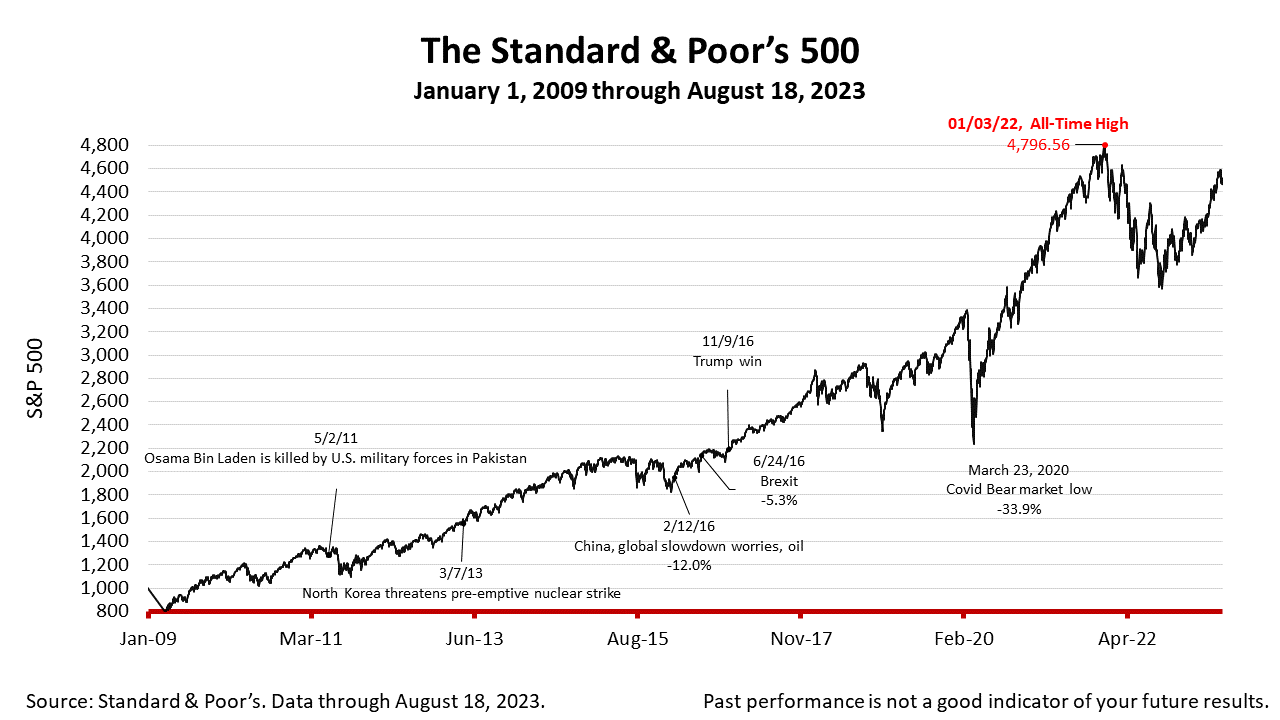
The Standard & Poor’s 500 stock index closed Friday at 4369.71, down -0.01% from Thursday, and -2.11% lower than a week ago. The index is up +95.30% from the March 23, 2020, bear market low and -8.90% lower than its January 3, 2022, all-time high.
The Standard & Poor's 500 (S&P 500) is an unmanaged group of securities considered to be representative of the stock market in general. It is a market-value weighted index with each stock's weight proportionate to its market value. Index returns do not include fees or expenses. Investing involves risk, including the loss of principal, and past performance is no guarantee of future results. The investment return and principal value of an investment will fluctuate so that an investor's shares, when redeemed, may be worth more or less than their original cost. Current performance may be lower or higher than the performance quoted.