

With more than 100,000 Russian troops poised to invade Ukraine, the Standard & Poor’s 500 stock index lost -1.9% of its value Friday, after troop movements of Russian forces reportedly made a war in Europe more likely to break out at any moment.
The economic news, however, remained positive overall despite the Ukraine conflict and inflation woes.
The consumer price index, an inflation metric, released yesterday, increased another six tenths of 1%. Inflation, over the last 12 months, increased to a 7.5%, the highest annual rate in 40 years.
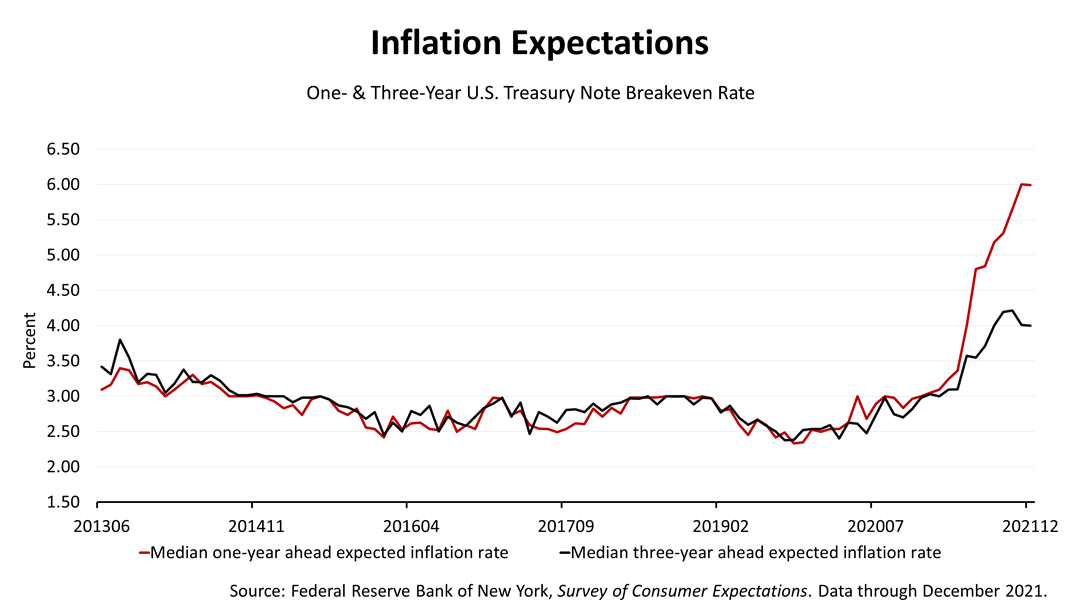
While a 7.5% inflation rate in the 12 months through January is higher than in four decades, investors expect moderating inflation in the next year. The red line shows bond investors are currently pricing in a 6% inflation rate for the next 12 months, according to the 1-year Treasury Note “break-even” rate. The breakeven rate is the difference between the yield on Treasury Notes or Bonds and the yield on Treasury Inflation Protected Securities (TIPS).
Inflation is running at a 7.5% annual rate for the past 12 months but investors expected inflation to slow to 6% in the next 12 months, and the black line shows investors are pricing in a 4% rate of inflation over the next three years. The bond market expects inflation, over the next three years, to be tamed to 4%. A cycle of out-of-control 1980s-style inflation is not expected.
And, apart from inflation, underlying economic fundamentals are very positive.
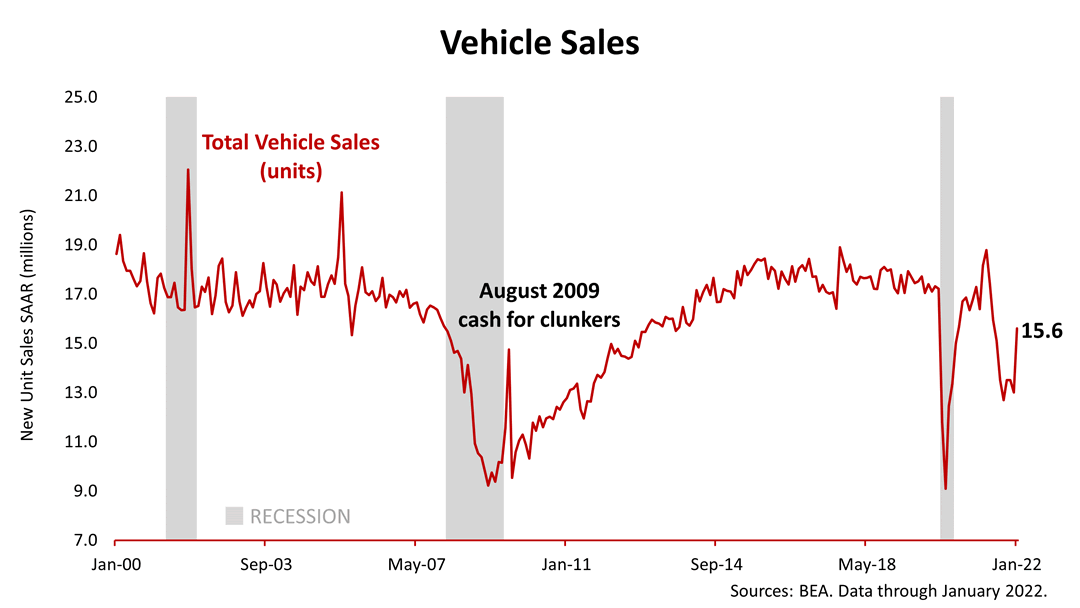
Auto sales are staging a rebound. The price of used and new cars has been inflated in recent months because new-car manufacturing was bottle-necked by a shortage of computer processor chips. The shortage of micro-chips may be over.
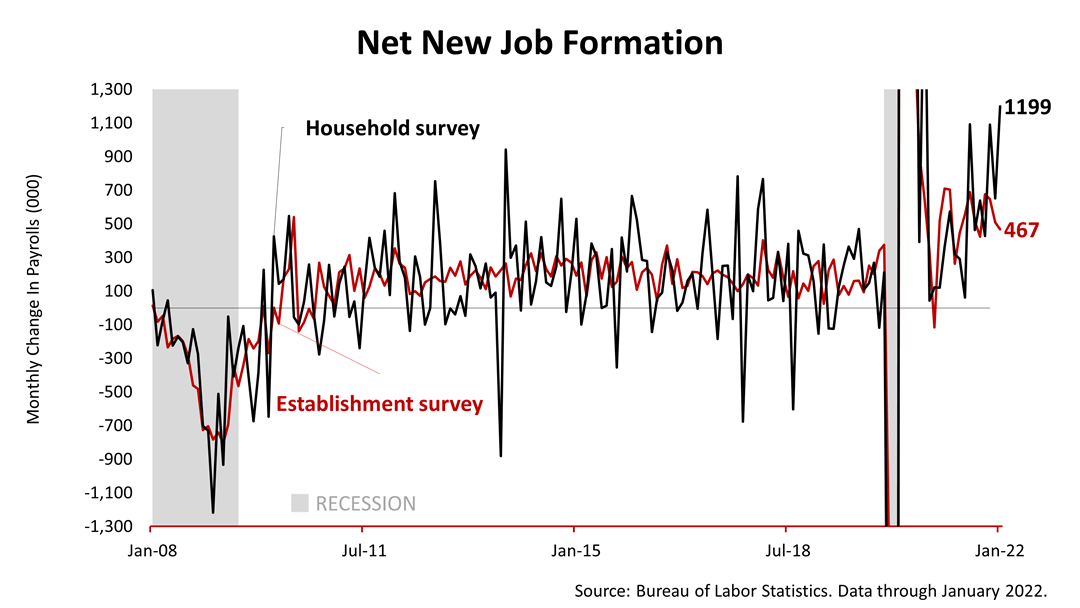
The Bureau of Labor Statistics measures U.S. job formation in two indexes. Both new job indicators have been above normal since the comeback from Covid began in May 2020.

The U.S., according to economic studies relied on by the Federal Reserve Bank, needs to build 1.5 million new single-family houses annually to keep up with population growth. However, the nation created many fewer homes than had been expected in the 11-year expansion after The Great Recession. This explains why some areas of the country are experiencing tight housing markets and higher prices. The post-Covid recovery, however, is characterized by housing starts consistently at or exceeding the 1.5 million mark for the first time in 15 years.
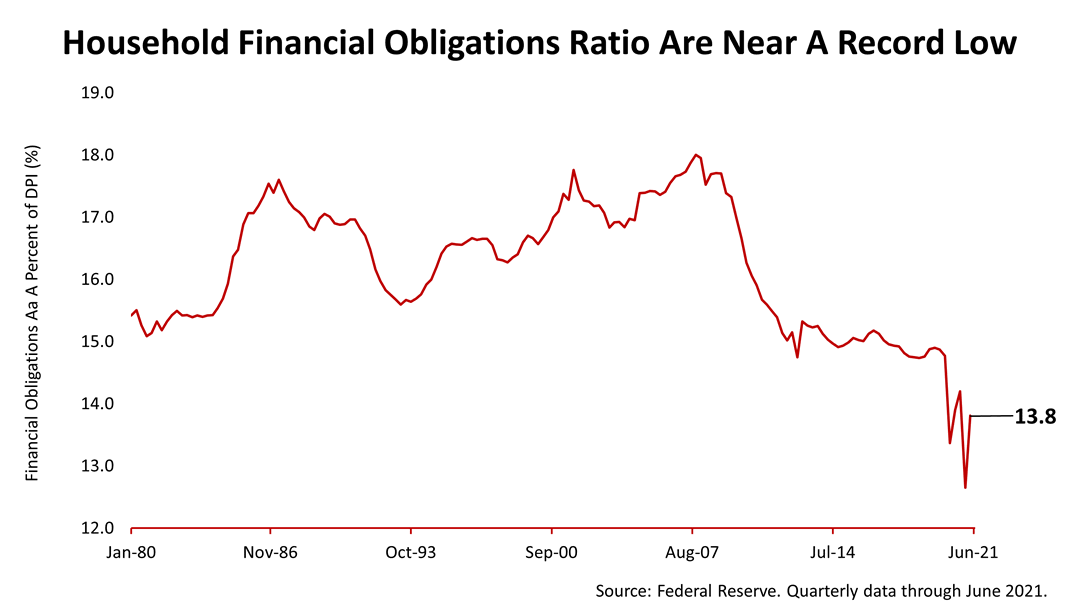
Monthly after-tax income that the average household pays for fixed recurring monthly obligations, such as a mortgage, car payment, utilities, real estate taxes, etc., is near a record low. Consumers are in the best shape in decades.
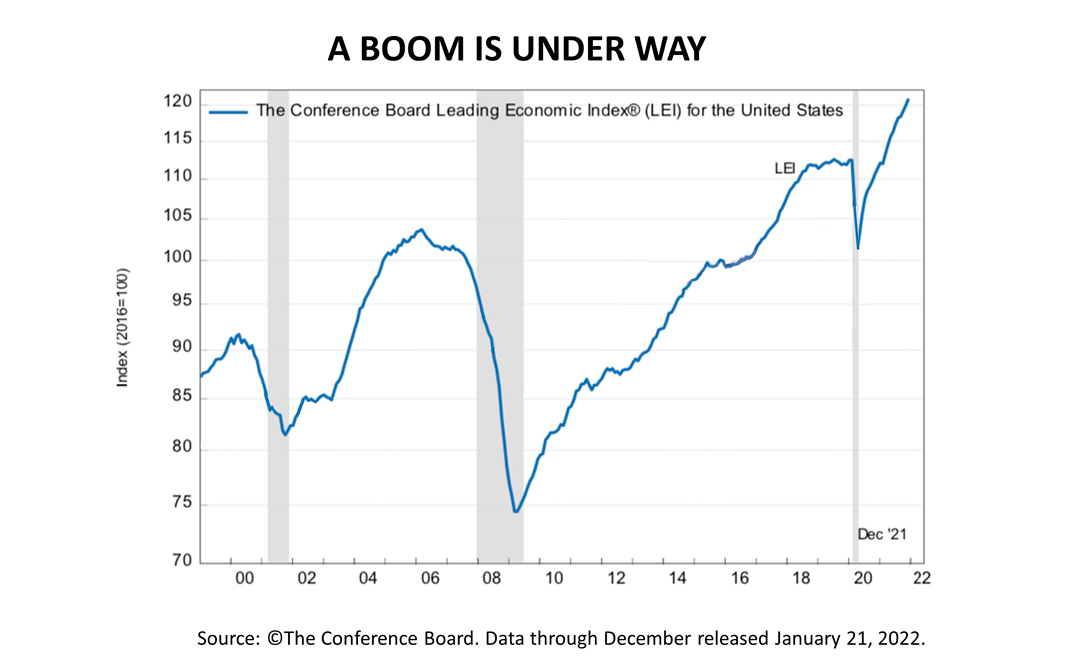 The forward-looking Leading Economic Indicators Index – comprised of 10 component indexes – is indicating a boom is underway. While the index did not foretell the pandemic, it collapsed months before every other post-War recession. Nothing like that is happening now, as of January 21 at least, when this data was released.
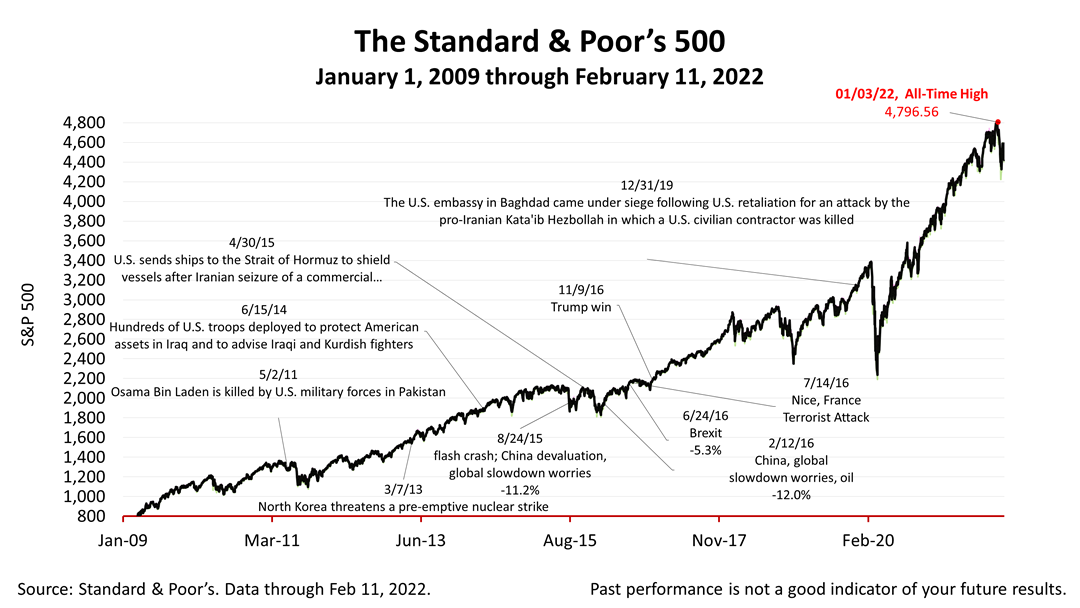
The Standard & Poor’s 500 stock index closed Friday, February 11, 2022, at 4,418.64. The index lost -1.9% from Thursday and -1.83% from last week’s closing price. The index is up +65.54% from the March 23, 2020, bear market low.
The Conference Board Leading Economic Index® (LEI) components are: 1) average weekly hours worked, manufacturing; 2) average weekly initial unemployment claims; 3) manufacturers’ new orders – consumer goods and materials; 4) ISM index of new orders; 5) manufacturers’ new orders, nondefense capital goods; 6) building permits – new private housing units; 7) stock prices, S&P 500; 8) Leading Credit Index™; 9) interest rate spread; 10-year Treasury minus fed funds; 10) index of consumer expectations.