
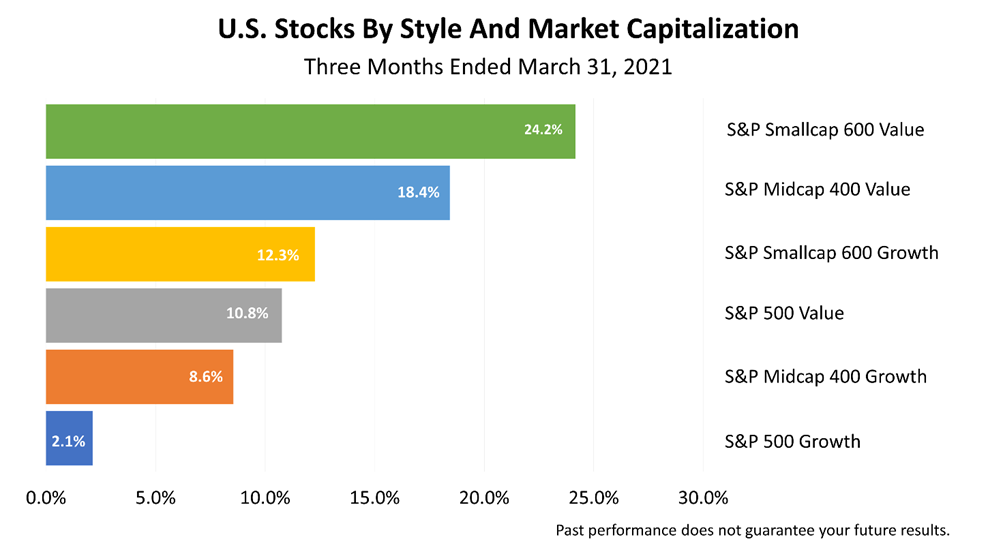
While a single quarter of data is usually not elucidating – it’s just not enough time and data to make a sweeping conclusion -- sometimes a single quarter tips you off to a shift in investor preferences. That’s true in this three-month snapshot. It shows the stock market investments classifying companies by market capitalization and style.
The fact that small-cap value led the market last quarter marked a reversal of the pandemic boom in which the super-cap growth stocks, like Amazon, Apple, Facebook, Microsoft, Netflix and Google, dominated returns and temporarily distorted the performance of the S&P 500 index.
Many stocks in the blue-chip Standard & Poor’s 500 index were weak relative to the tech giants earlier in the pandemic. The tech giants grew stronger during the pandemic because their solutions were used more than expected, triggering larger than expected profits in a handful of super-large cap stocks.
Since the S&P 500 index is market-weighted, the price surge in the super-large tech companies became more influential in the S&P 500 index. That trend was reversed last quarter and again in the first quarter of 2021 ended March 31, 2021.
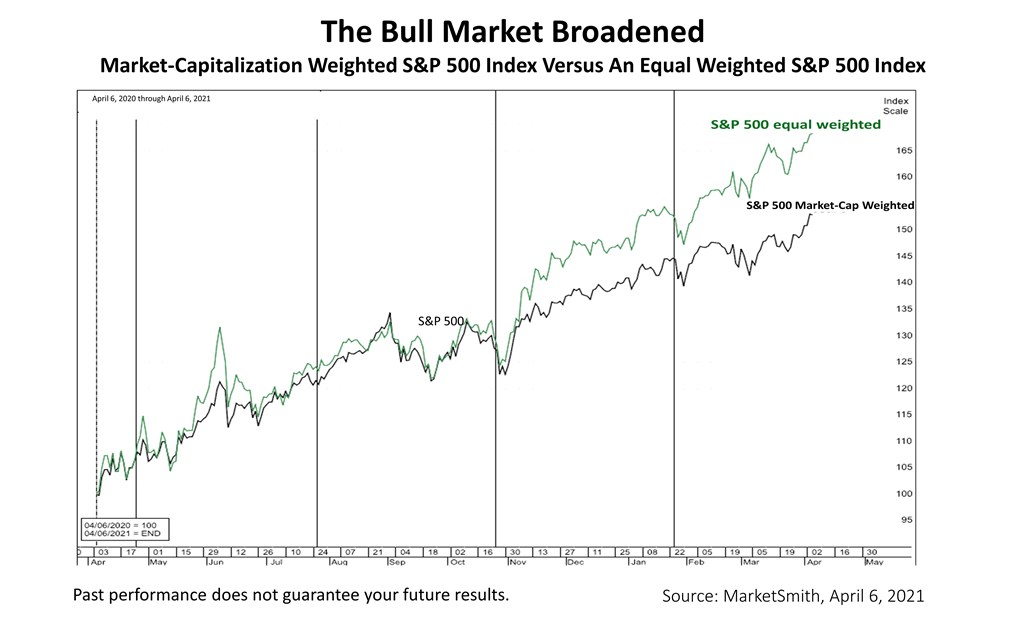
Since the election, the bull market broadened out. Value and small-cap stocks have surged. In this chart, the equal-weighted Standard & Poor’s 500 stock index is outperforming the market-capitalization weighted S&P 500 index, which is commonly quoted and the main benchmark of U.S. stock performance.
Investors have viewed the election of President Biden in very positive terms, undoubtedly because of the enormous fiscal stimulus the new administration is pursuing. The larger role played by the government in responding to the Covid economic crisis will be subject to political debate. No matter your politics, however, the broadening of the bull market is a good trend for stock market investors.