
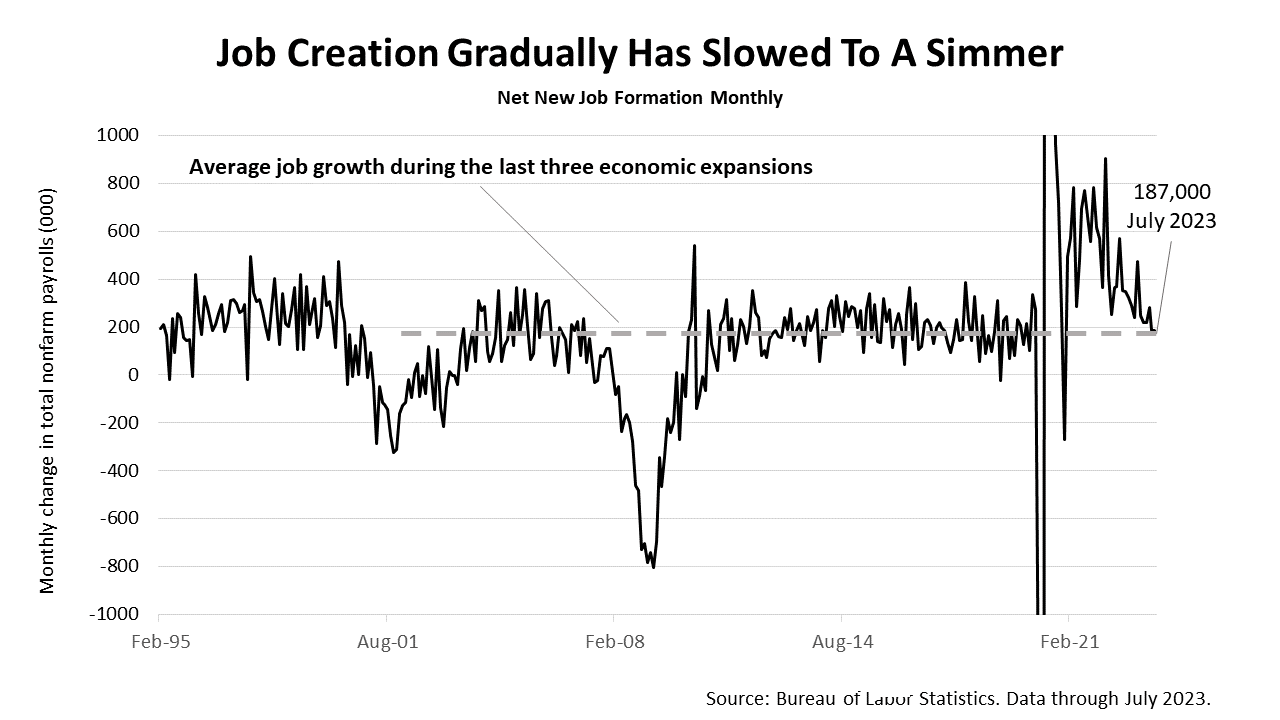
The U.S. economy created 187,000 new jobs in July. That’s slightly less than the 200,000 expected but more importantly it is in line with the last two expansion cycles.
The dotted gray line highlights the monthly job creation rate through July 2023 is now settling at the rate averaged through the past two economic expansions.
This is a recipe for healthy growth slowing to a simmer.
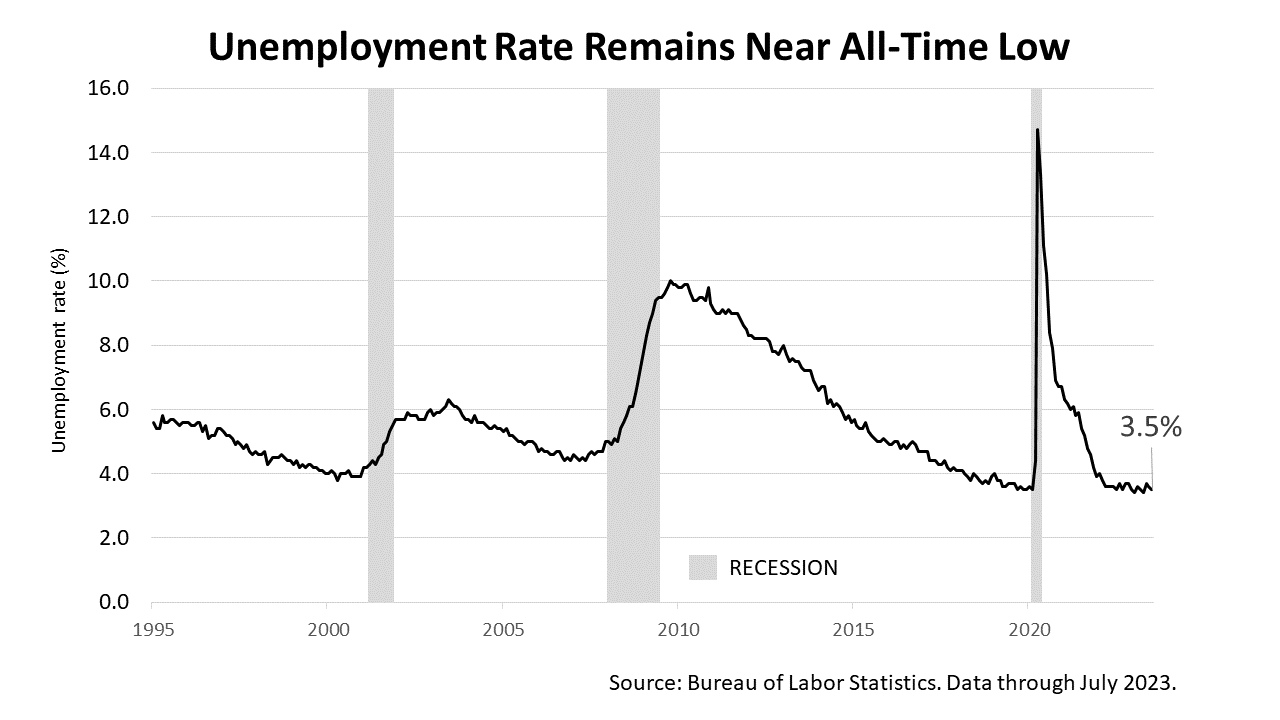
The unemployment rate in July ticked down to 3.5%, remaining near the all-time low. Recessions are not known to occur when a nation’s labor force is fully employed. Rather, full employment sets off booms.
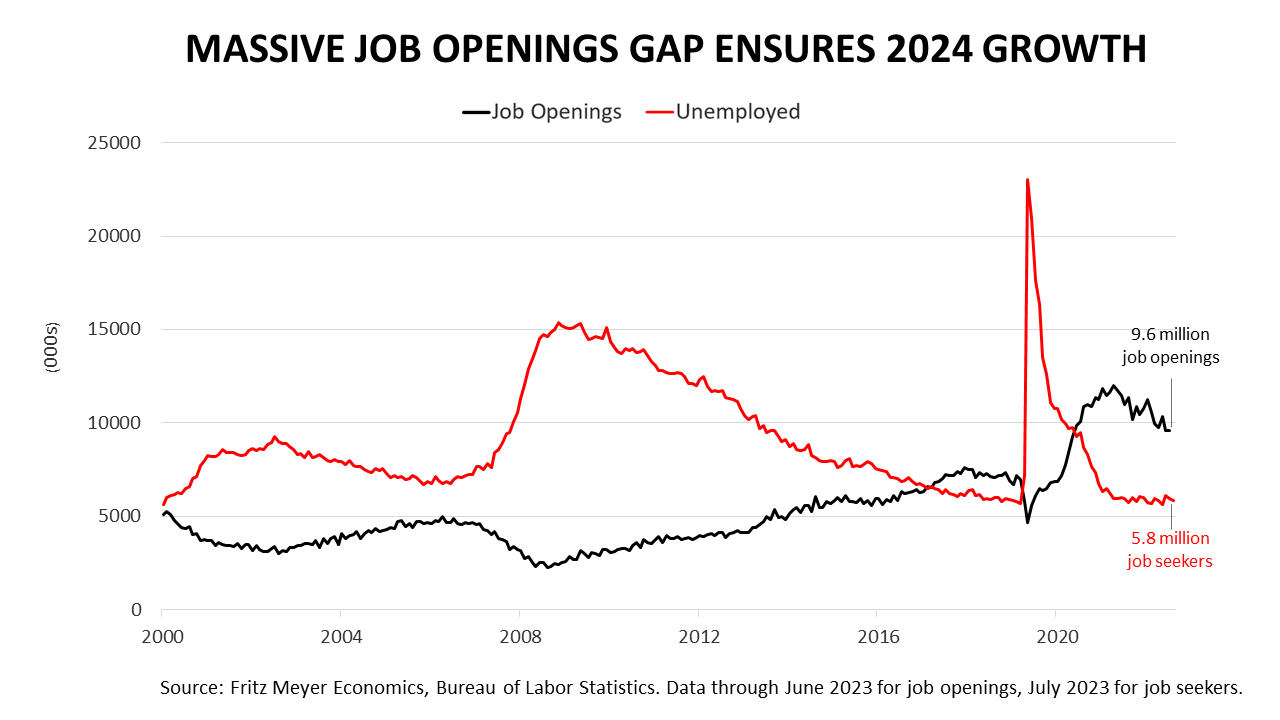
Normally, job seekers outnumber openings, as they did from 2000 to 2016. Not now.
The massive jobs openings gap shown in this chart is very unusual and ensures growth in the months ahead.
After the pandemic, job openings soared before peaking in March 2022, when two job openings were available for every unemployed person in the U.S. labor force.
The job openings gap has narrowed in the last 16 months. About 1.6 jobs are open for every job seeker. That’s still a substantial gap and ensures growth is ahead as the U.S. fills that gap.
According to an article in The Wall Street Journal on Friday, August 4, the Labor Department in February adjusted its population estimates higher, making an addition of 871,000 people to its labor force estimate — that is, the number of people who are employed or actively looking for a job. “It upped its population estimate”, according to The Journal. “If immigration continues at its recent pace, it might be releasing upward adjustments again next February.”
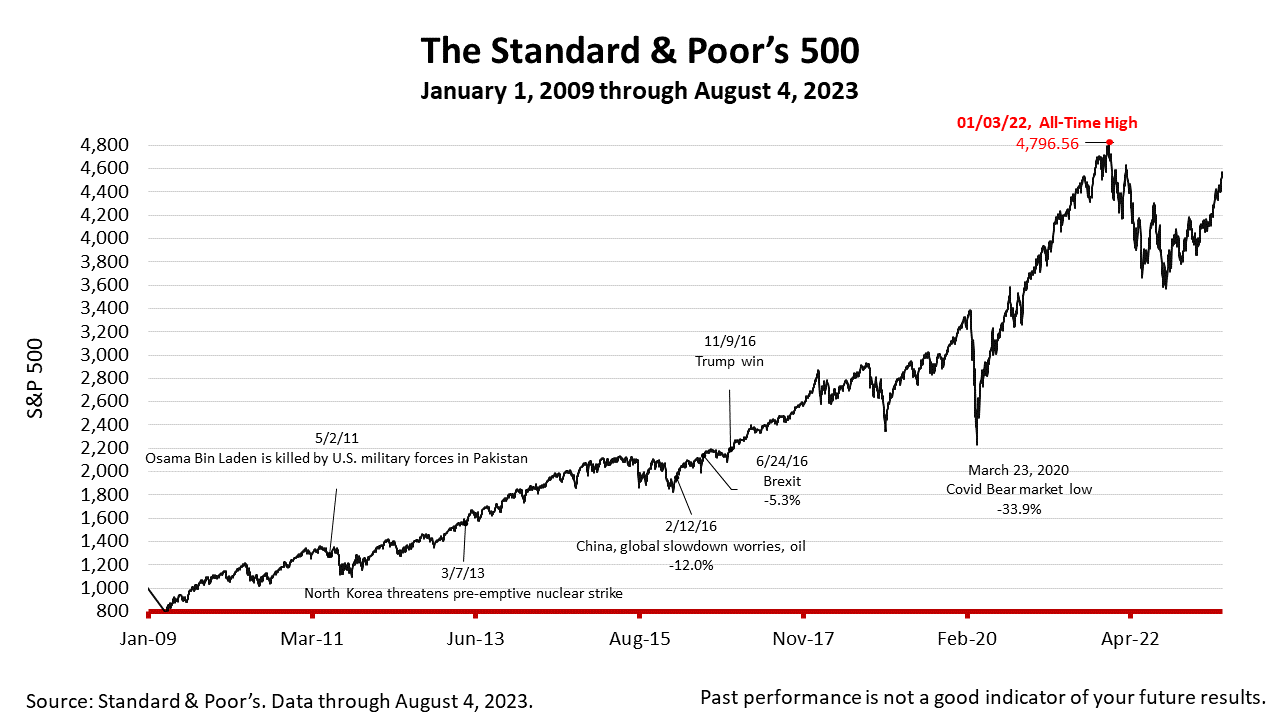
The Standard & Poor’s 500 stock index closed Friday at 4478.03, down -0.53% from Thursday, and -2.42% lower than a week ago. The index is up +100.14% from the March 23, 2020 bear market low and down -6.64% from its January 3, 2022, all-time high.
The Standard & Poor's 500 (S&P 500) is an unmanaged group of securities considered to be representative of the stock market in general. It is a market-value weighted index with each stock's weight proportionate to its market value. Index returns do not include fees or expenses. Investing involves risk, including the loss of principal, and past performance is no guarantee of future results. The investment return and principal value of an investment will fluctuate so that an investor's shares, when redeemed, may be worth more or less than their original cost. Current performance may be lower or higher than the performance quoted.
This website uses cookies for navigation, content delivery and other functions. By using our website you agree that we can place cookies on your device. I understand
