
The growth of the economy drives investment returns, and plain and simple, corporate profits—that is, earnings—drive stock prices. Without an understanding of what drives stock prices, investors are often fearful when stock prices plunge or, ironically, when they are breaking record highs. Here’s some help.
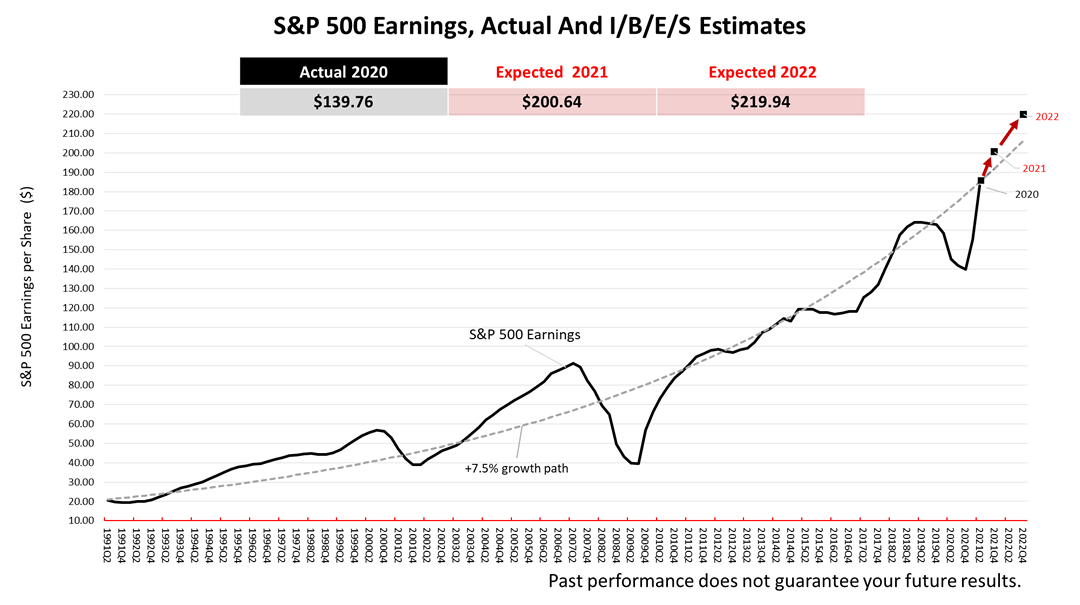
Perhaps the most direct way of connecting the dots between economics and investing is this chart illustrating that what drives stock prices is earnings.
The gray dotted line shows the 7.5% long-term earnings growth trend since 1991. In 2020, actual earnings of the S&P 500 companies were $139.76 per share. Expected earnings in 2021, according to Wall Street analysts’ estimates compiled by Institutional Brokers' Estimate System (IBES), are $200.64 per share and are expected to shoot up to $219.94 for 2022.
The red arrows literally connect the dots to make the forecast clear: The next 20 months’ corporate earnings are expected to rocket much higher.
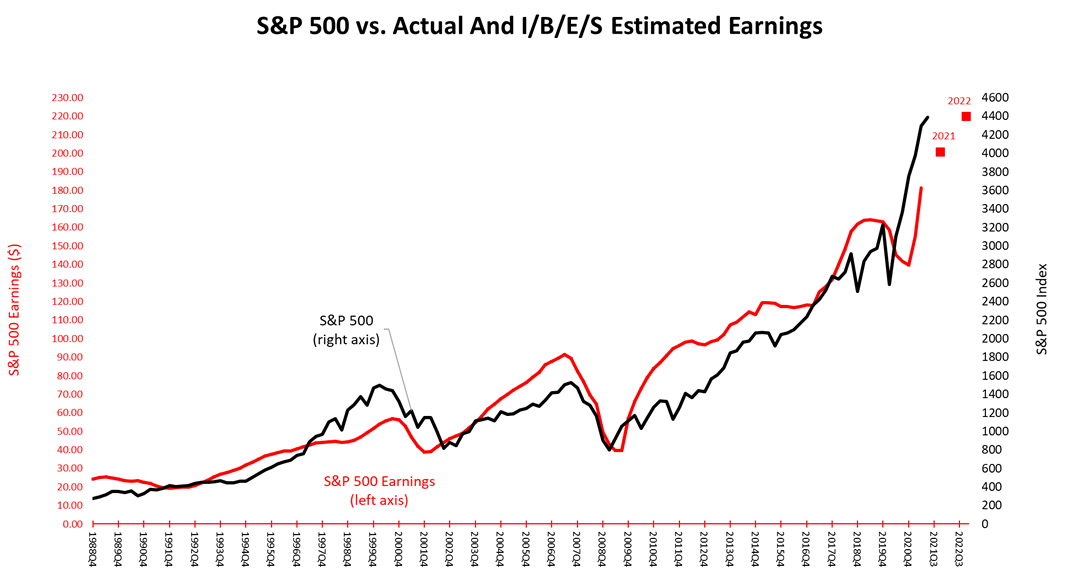
In this chart, to show how earnings drive stock prices, we added the S&P 500 Total Return index, in the black line to the earnings line in red. This shows the nearly perfect correlation between stock prices and earnings since 1989. The 2021 and 2022 earnings forecasts, in the red dots, have pulled the black line higher.
This website uses cookies for navigation, content delivery and other functions. By using our website you agree that we can place cookies on your device. I understand
